The Coding Mant.is

Smashing Through Code

Introduction to Cloud Foundry’s Health Monitor — 17-December-2014

Introduction to Cloud Foundry’s Health Monitor

What is the Health Monitor?

The purpose of the Health Monitor (HM) is to monitor all existing apps and ensure that the appropriate number of instances are running. If there is a discrepancy, then the HM will either prompt the Cloud Controller to start new instances (if there are too few) or stop existing instances (if there are too many).

Some Background

The current release of the Health Monitor is called the Health Monitor 9000 (usually seen as HM9000 or HM9K). The HM9K is a complete rewrite of the Health Monitor. According to the release post, the maintainers’ main goals for the rewrite were to:

  • Solve the then-issue that the HM was a single point of failure
  • Make use of newer technologies (Go, etcd instead of Ruby)
  • Get into the practice of replacing existing components with rewrites

The switch to Go/etcd provides the key difference between the original HM and the HM9K: the ability to store information about the state of the environment in a database instead of in component memory. This not only allows multiple instances of the HM to work concurrently, but also keeps the information available in the event of a single component failure.

How does the HM work?


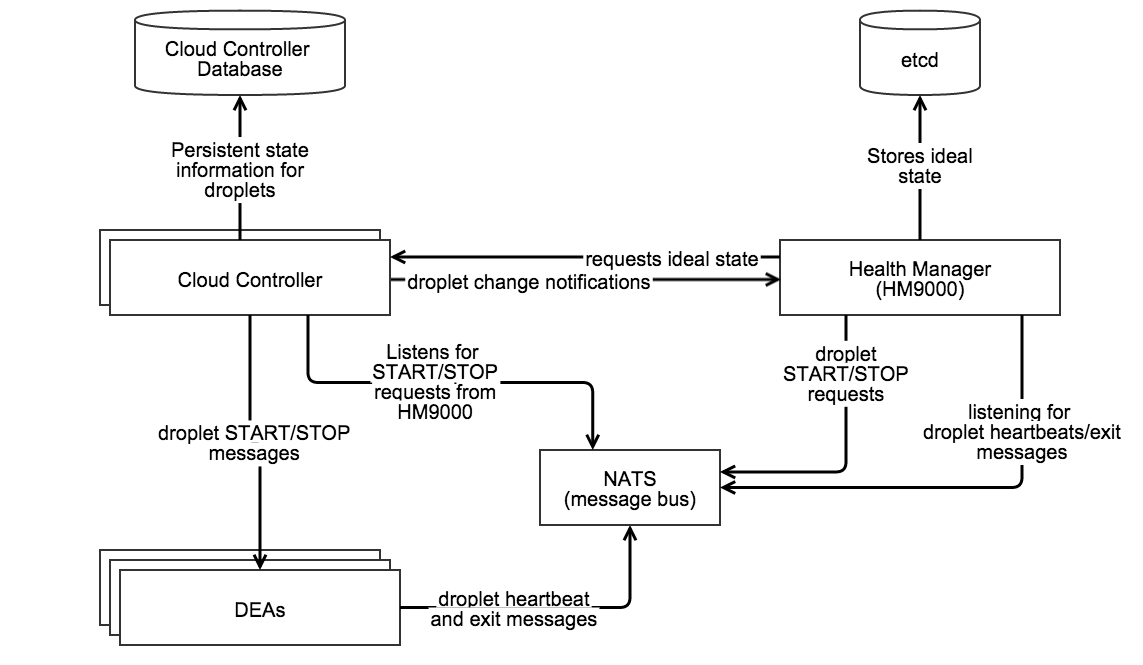
Source: home grown diagram made with Gliffy.

  • Requests the ideal state of the droplets from the Cloud Controller
  • Stores the ideal state in etcd
  • Listens to droplet heartbeats over NATS to obtain the actual state of the droplets
  • Sends droplet START/STOP requests over NATS
  • Moves applications to DEAs during a rolling deploy

Since the HM9K has a great deal of control, it’s been limited to only take actions if the information it is using is “fresh”. Specifically:

  • The actual state is “fresh” if the HM9K has an active NATS connection, is regularly receiving DEA heartbeats, and is able to successfully store the actual state into etcd.
  • The desired state is “fresh” if the HM9K successfully downloads the desired state from Cloud Controller (without timing out) and successfully stores the information into etcd.

If either the actual or desired states are not fresh, the HM9K will stop taking any actions.

What if something goes wrong?

Tips for troubleshooting the HM9K from Onsi @ Pivotal (who is now famous for his talk about Diego):

  • Make sure hm9000_noop is set correctly. When set to false the Cloud Controller will use the HM9K, but if set to true it will use health_manager_next. (which was the predecessor to the HM9K).
  • Verify that etcd is not in a bad state. Typically etcd will only enter a bad state during deployment rather than later. If etcd is in a bad state, you will notice that the HM9K will no longer be able to store current information about the state of the environment. When this happens you should restart etcd by doing the following:
    • bosh ssh into the etcd node
    • Run monit stop all
    • Delete the etcd data directory under /var/vcap/store
    • Repeat for all etcd nodes
    • Once complete for all nodes, restart them by running monit start all.
  • Verify that Cloud Controller is able to send the desired state in time*. (Recall that if the data is not sent/received in time, then the state loses freshness and the HM9K will no longer take any action.) Check the logs of the desired_state_fetcher to view the status . Typically this is only a problem when the Cloud Controller is under heavy load.
    • * What “in time” is and whether you can change it depends on your version of Cloud Foundry. As of Jul 24 2014 users can control the timeout value by setting the hm9000.fetcher_network_timeout_in_seconds parameter in the manifest. The default value is currently 30 seconds. Prior to this, the timeout was set to 10 seconds and was not user configurable.
  • Check the load on etcd. According to the README, if the DesiredStateSyncTimeInMilliseconds exceeds ~5000 (5 seconds) and the ActualStateListenerStoreUsagePercentage exceeds 50-70% then clustered etcd may be unable to handle the load. The current workaround for this issue is to run a single HM9K node instead of a cluster.

View the contents of the store

If you bosh ssh into HM9K VM you can run:

/var/vcap/packages/hm9000/hm9000 dump --config=/var/vcap/jobs/hm9000/config/hm9000.json

This will fetch both the desired and actual state from etcd and print out a pretty-formatted birds-eye view of all running & desired apps on your cloud foundry installation. You can also get raw JSON output by passing dump the --raw flag.

I have included some example output below. This is for a CF instance that has a single application with five instances:

$ /var/vcap/packages/hm9000/hm9000 dump --config=/var/vcap/jobs/hm9000/config/hm9000.json
Dump - Current timestamp 1418830322
Store is fresh
====================

Guid: 9d7923df-1e45-4201-943b-0cf2ec086ee9 | Version: 561f3b0c-8beb-4faa-af48-07b4f8ad379e
  Desired: [5] instances, (STARTED, STAGED)
  Heartbeats:
    [4 RUNNING] 2e9e4142946743f2ba5372cc1c29aa86 on 0-1c4
    [1 RUNNING] 5989d49130c8440aa86abf22c5f10215 on 0-1c4
    [2 RUNNING] 0673b4cc39464025b3d6ae6be5a9f285 on 0-1c4
    [3 RUNNING] ff875188ca73454aa67a0acf689b3e29 on 0-1c4
    [0 RUNNING] 017b2076a4024416bb8cee7dd86df59c on 0-1c4

RAW output for the above:

$ /var/vcap/packages/hm9000/hm9000 dump --config=/var/vcap/jobs/hm9000/config/hm9000.json --raw
Raw Dump - Current timestamp 1418830336
/hm/locks/Analyzer [TTL:9s]:
    9eefca86-cb36-4407-7af7-1d0b7a43df22
/hm/locks/Fetcher [TTL:8s]:
    66a2c18e-8095-4cd8-5e86-0a5a3d998c3e
/hm/locks/Sender [TTL:10s]:
    3fbb6b85-d608-433d-51b5-cd35d57e2150
/hm/locks/Shredder [TTL:8s]:
    5e699aa8-8af1-4013-7313-f57bfc9f72ce
/hm/locks/evacuator [TTL:7s]:
    6c39a226-bc89-40b5-67c9-b1644184ffe8
/hm/locks/listener [TTL:9s]:
    2be6e723-6edc-4b18-62f8-aec200be161d
/hm/locks/metrics-server [TTL:6s]:
    43014106-65db-4f36-5eb8-98a617108529
/hm/v4/actual-fresh [TTL:22s]:
    {
      "timestamp": 1418758444
    }
/hm/v4/apps/actual/9d7923df-1e45-4201-943b-0cf2ec086ee9,561f3b0c-8beb-4faa-af48-07b4f8ad379e/017b2076a4024416bb8cee7dd86df59c [TTL: ∞]:
    0,RUNNING,1418830256.8,0-1c470b76e6a34de396016de6484ea9e1
/hm/v4/apps/actual/9d7923df-1e45-4201-943b-0cf2ec086ee9,561f3b0c-8beb-4faa-af48-07b4f8ad379e/0673b4cc39464025b3d6ae6be5a9f285 [TTL: ∞]:
    2,RUNNING,1418830258.6,0-1c470b76e6a34de396016de6484ea9e1
/hm/v4/apps/actual/9d7923df-1e45-4201-943b-0cf2ec086ee9,561f3b0c-8beb-4faa-af48-07b4f8ad379e/2e9e4142946743f2ba5372cc1c29aa86 [TTL: ∞]:
    4,RUNNING,1418830258.2,0-1c470b76e6a34de396016de6484ea9e1
/hm/v4/apps/actual/9d7923df-1e45-4201-943b-0cf2ec086ee9,561f3b0c-8beb-4faa-af48-07b4f8ad379e/5989d49130c8440aa86abf22c5f10215 [TTL: ∞]:
    1,RUNNING,1418830258.6,0-1c470b76e6a34de396016de6484ea9e1
/hm/v4/apps/actual/9d7923df-1e45-4201-943b-0cf2ec086ee9,561f3b0c-8beb-4faa-af48-07b4f8ad379e/ff875188ca73454aa67a0acf689b3e29 [TTL: ∞]:
    3,RUNNING,1418830258.5,0-1c470b76e6a34de396016de6484ea9e1
/hm/v4/apps/desired/9d7923df-1e45-4201-943b-0cf2ec086ee9,561f3b0c-8beb-4faa-af48-07b4f8ad379e [TTL: ∞]:
    5,STARTED,STAGED
/hm/v4/dea-presence/0-1c470b76e6a34de396016de6484ea9e1 [TTL:22s]:
    0-1c470b76e6a34de396016de6484ea9e1
/hm/v4/desired-fresh [TTL:112s]:
    {
      "timestamp": 1418829728
    }
/hm/v4/metrics/ActualStateListenerStoreUsagePercentage [TTL: ∞]:
    0.00295
/hm/v4/metrics/DesiredStateSyncTimeInMilliseconds [TTL: ∞]:
    1.07322
/hm/v4/metrics/ReceivedHeartbeats [TTL: ∞]:
    13.00000
/hm/v4/metrics/SavedHeartbeats [TTL: ∞]:
    13.00000
/hm/v4/metrics/StartCrashed [TTL: ∞]:
    0.00000
/hm/v4/metrics/StartEvacuating [TTL: ∞]:
    0.00000
/hm/v4/metrics/StartMissing [TTL: ∞]:
    0.00000
/hm/v4/metrics/StopDuplicate [TTL: ∞]:
    0.00000
/hm/v4/metrics/StopEvacuationComplete [TTL: ∞]:
    0.00000
/hm/v4/metrics/StopExtra [TTL: ∞]:
    5.00000

For more information, please see the HM9K README.

An example issue and its resolutions from VCAP Dev

Issue: cf apps shows 0/N apps running

Specifically, the output shows:

Showing health and status for app rubytest in org org / space space as user...
OK

requested state: started
instances: 0/1
usage: 1G x 1 instances
urls: rubytest.mydomain.dev

     state     since                    cpu    memory        disk
#0   running   2014-03-20 12:00:19 PM   0.0%   76.2M of 1G   58.7M of 1G

The logs show some bizarre behavior as well:

{"timestamp":1395331896.365486,"message":"harmonizer: Analyzed 1 running 1 missing instances. Elapsed time: 0.009356267","log_level":"info","source":"hm","data":{},"thread_id":16810120,"fiber_id":24014660,"process_id":6740,"file":"/var/vcap/packages/health_manager_next/health_manager_next/lib/health_manager/harmonizer.rb","lineno":229,"method":"finish_droplet_analysis"}

Followed later by:

{"timestamp":1395332173.518845,"message":"harmonizer: droplet GC ran. Number of droplets before: 2, after: 1. 1 droplets removed","log_level":"info","source":"hm","data":{},"thread_id":16810120,"fiber_id":24014660,"process_id":6740,"file":"/var/vcap/packages/health_manager_next/health_manager_next/lib/health_manager/harmonizer.rb","lineno":184,"method":"gc_droplets"}

So although initially the number of running applications is incorrectly identified, at some point the HM9K does clean up the extra instance.

Solution: The poster of the above indicated that the solution to his issue was that the Cloud Controller was working with the incorrect Health Monitor – health_manager_next instead of HM9K.

A later poster was using the HM9K and reported an experience with the same behavior. By running cf apps he saw output similar to the above for all his apps, and when he tailed /var/vcap/sys/log/hm9000/hm9000_listener.stdout.log there were no logged heartbeats.

He stated that he discovered that the issue was caused by his etcd nodes becoming unclustered. Since he could not directly resolve the issue, he followed the steps for what to do when etcd entered a bad state and successfully re-created the cluster.

Resources

[From my work blog here.]

Running Cloud Foundry Locally with BOSH Lite —

Running Cloud Foundry Locally with BOSH Lite

Want to play with Cloud Foundry without using TryCF (requires AWS) or setting up a trial account with one of the PaaS providers out there (e.g. PWS)? Why not set it up on your own laptop?

Getting Started

The 411 on my laptop:

  • 2012 Retina Macbook Pro
  • 16 GB RAM
  • 768 GB SSD
  • 2.7 GHz i7 processor
  • Mac OS 10.10.1

FYI: I have already installed the CF CLI tools on my laptop, so although I will explain how to install the CF CLI tools I will not be installing it again at this time.

It’s worth mentioning that I did also try running Cloud Foundry on a different Macbook with 8 GB of RAM with limited success. So for the RAM at least I would recommend having 16 GB+. This will provide enough memory for Cloud Foundry to run more comfortably alongside the system processes.

Ruby, Go, Vagrant, and VirtualBox

Make sure that you have:

  • the latest stable release of Go
  • the latest stable release of Ruby
    • Optional: RVM
      Not directly required for Cloud Foundry, but this will come in handy if you need to install/manage more than one version of Ruby.
  • the latest release of Vagrant
  • the latest release of VirtualBox

Before proceeding, check the installed versions using go version, rvm list (or ruby --version if you do not have RVM), vagrant --version, and vboxmanage --version. I am currently running the latest stable releases for all the above, in addition to version 1.9.3 for Ruby.

$ go version
go version go1.3.3 darwin/amd64

$ rvm list

rvm rubies

   ruby-1.9.3-p551 [ x86_64 ]
=* ruby-2.1.5 [ x86_64 ]

# => - current
# =* - current && default
#  * - default

$ vagrant --version
Vagrant 1.6.5

$ vboxmanage --version
4.3.18r96516

Installing BOSH Lite

In order to run Cloud Foundry you must first install BOSH. To provide some basic familiarity, there are three “types” of BOSH (if you will):

  • microBOSH
  • BOSH
  • BOSH Lite

BOSH is used to deploy Cloud Foundry and microBOSH is used to deploy BOSH. BOSH Lite is used for local instances of Cloud Foundry – for example on a laptop like I’m doing.

The instructions for installing BOSH Lite are available on the BOSH Lite README. I followed the instructions for Vagrant and VirtualBox.

BOSH Lite install failure: nokogiri

When I first tried to install BOSH Lite with gem install bosh_cli the installation failed because it needed nokogiri:

...
Fetching: nokogiri-1.6.5.gem (100%)
Building native extensions.  This could take a while...
ERROR:  Error installing bosh_cli:
  ERROR: Failed to build gem native extension.
...

I had actually run into this issue before, on another Macbook running OS 10.9.x. I was only able to install nokogiri using the Xcode CLI tools:

$ xcode-select --install
xcode-select: note: install requested for command line developer tools

$ gem install nokogiri -- --with-xml2-include=/Applications/Xcode.app/Contents/Developer/Platforms/MacOSX.platform/Developer/SDKs/MacOSX10.9.sdk/usr/include/libxml2
Building native extensions with: '--with-xml2-include=/Applications/Xcode.app/Contents/Developer/Platforms/MacOSX.platform/Developer/SDKs/MacOSX10.9.sdk/usr/include/libxml2'
This could take a while...
Successfully installed nokogiri-1.6.5
Parsing documentation for nokogiri-1.6.5
Installing ri documentation for nokogiri-1.6.5
Done installing documentation for nokogiri after 3 seconds
1 gem installed

(The Xcode CLI tools install will pop up a software agreement via the App Store that you must agree to in order to install the software. The installation/updates for the Xcode CLI tools will subsequently be handled in the App Store.)

Once nokogiri was installed, I was able to install the BOSH CLI tools without difficulty.

The first time you start the VM, Vagrant will use the Vagrantfile in the BOSH Lite directory to install/create the VM. You should see something similar to the following:

$ vagrant up --provider=virtualbox
Bringing machine 'default' up with 'virtualbox' provider...
==> default: Box 'cloudfoundry/bosh-lite' could not be found. Attempting to find and install...
    default: Box Provider: virtualbox
    default: Box Version: 388
==> default: Loading metadata for box 'cloudfoundry/bosh-lite'
    default: URL: https://vagrantcloud.com/cloudfoundry/bosh-lite
==> default: Adding box 'cloudfoundry/bosh-lite' (v388) for provider: virtualbox
    default: Downloading: https://vagrantcloud.com/cloudfoundry/boxes/bosh-lite/versions/388/providers/virtualbox.box
==> default: Successfully added box 'cloudfoundry/bosh-lite' (v388) for 'virtualbox'!
==> default: Importing base box 'cloudfoundry/bosh-lite'...
==> default: Matching MAC address for NAT networking...
==> default: Checking if box 'cloudfoundry/bosh-lite' is up to date...
==> default: Setting the name of the VM: bosh-lite_default_1418694875085_89186
==> default: Clearing any previously set network interfaces...
==> default: Preparing network interfaces based on configuration...
    default: Adapter 1: nat
    default: Adapter 2: hostonly
==> default: Forwarding ports...
    default: 22 => 2222 (adapter 1)
==> default: Running 'pre-boot' VM customizations...
==> default: Booting VM...
==> default: Waiting for machine to boot. This may take a few minutes...
    default: SSH address: 127.0.0.1:2222
    default: SSH username: vagrant
    default: SSH auth method: private key
    default: Warning: Connection timeout. Retrying...
==> default: Machine booted and ready!
==> default: Checking for guest additions in VM...
==> default: Setting hostname...
==> default: Configuring and enabling network interfaces...
==> default: Mounting shared folders...
    default: /vagrant => /Users/quinn/Development/BOSHlite/bosh-lite

You should then be able to target the BOSH Lite director and update your routing table:

$ bosh target 192.168.50.4 lite
Target set to `Bosh Lite Director'
Your username: admin
Enter password: *****
Logged in as `admin'

$ bin/add-route
Adding the following route entry to your local route table to enable direct warden container access. Your sudo password may be required.
  - net 10.244.0.0/19 via 192.168.50.4
Password:
add net 10.244.0.0: gateway 192.168.50.4

Note: when I did this install on another laptop running OS 10.9.x, I ran into an issue where the route script could not run and terminated with the error route: command not found. Turns out, somehow my PATH variable had become foobar-ed (technical term) at some point. Fixing my PATH variable resolved the issue.

Deploying Cloud Foundry

Now we’re going to hop over to the Cloud Foundry install instructions. Using the install script:

  • Install spiff (requires Homebrew)
  • Clone the cf-release repo
  • Run ./bin/provision_cf

Install script failure: timeout

The only real issue I encountered during the installation is that when I ran the script, I encountered the following error a few times (which halted the install):

Blobstore error: Failed to fetch object, underlying error: #<HTTPClient::ReceiveTimeoutError: execution expired>

After a quick search I found that people just restarted the install and it would complete. The install does not redownload packages that have already been downloaded, it just flags that there are already local copies until it gets to the packages it hasn’t downloaded yet.

For reference, I had to run the script a total of three times before all the packages were downloaded successfully. I did not encounter any other issues with my installation.

Installing the CF CLI tools

Personally, I installed the CF CLI tools using the latest binary installer (linked on the README). Currently the development team is also experimenting with a Homebrew install, but that is still in the experimental phase at the time of this writing.

As a quick verification that the CLI tools are installed correctly, try checking the version. You should see something similar to the following:

$ cf --version
cf version 6.7.0-c38c991-2014-11-12T01:45:23+00:00

Creating the initial Org and Space

Targeting the API and logging in is the same procedure that you would use with a PaaS provider (e.g. PWS) or TryCF (requires AWS):

$ cf api --skip-ssl-validation https://api.10.244.0.34.xip.io 
Setting api endpoint to https://api.10.244.0.34.xip.io...
OK


API endpoint:   https://api.10.244.0.34.xip.io (API version: 2.18.0)
Not logged in. Use 'cf login' to log in.

$ cf login
API endpoint: https://api.10.244.0.34.xip.io

Email> admin

Password>
Authenticating...
OK

Select an org (or press enter to skip):

Org>


API endpoint:   https://api.10.244.0.34.xip.io (API version: 2.18.0)
User:           admin
No org or space targeted, use 'cf target -o ORG -s SPACE'

At first you won’t have any orgs (or spaces):

$ cf orgs
Getting orgs as admin...

name
No orgs found

This is different from service providers like PWS and TryCF, both of which have an org and a development space when they are created. Although orgs and spaces will be discussed in greater detail separately, please go ahead and create an org and at least one space. Follow the output suggestions to target the org and space.

$ cf create-org quinn
Creating org quinn as admin...
OK
TIP: Use 'cf target -o quinn' to target new org

$ cf target -o quinn
API endpoint:   https://api.10.244.0.34.xip.io (API version: 2.18.0)
User:           admin
Org:            quinn
Space:          No space targeted, use 'cf target -s SPACE'

$ cf create-space development
Creating space development in org quinn as admin...
OK
Assigning role SpaceManager to user admin in org quinn / space development as admin...
OK
Assigning role SpaceDeveloper to user admin in org quinn / space development as admin...
OK
TIP: Use 'cf target -o quinn -s development' to target new space

$ cf target -o quinn -s development
API endpoint:   https://api.10.244.0.34.xip.io (API version: 2.18.0)
User:           admin
Org:            quinn
Space:          development

[From my work blog entry here.]

Code spelunking to build a CF Plugin — 5-December-2014

Code spelunking to build a CF Plugin

This is a quick “how to” for how Long found the information he needed to build the cf info plugin.

Following a trail of breadcrumbs

Determine the requirements:

  1. Print the currently targeted org and space
  2. Print the API version and endpoint
  3. Print the user id of the current user (similar to whoami in *nix OSes).

Fulfilling the requirements:

This information comes from cf target, so first we’ll take a look in target.go.

  • Line 83 in target.go prints the current session information as reported from ui.go.
  • Line 196 in ui.go references a UserEmail method.
  • Line 175 of ui.go shows that config is actually from the core_config package.
  • There are a few *.go files in the core_config package, but searching this repository for UserEmail shows that the method is defined in config_repository.go on lines 199-204.
  • UserEmail requires a struct, called ConfigRepository.
  • ConfigRepository is built from the NewRepositoryFromPersistor method. (You can tell this both by the return &amp;ConfigRepository on line 23 or by noting that NewRepositoryFromPersistor returns all the fields needed by the struct – i.e. data, mutex, initOnce, persistor, and onError.)
  • NewRepositoryFromPersistor is returned from the method above it, NewRepositoryFromFilepath.

How to get the file path? Searching for CF_HOME (environmental variable storing the home directory) shows that it is defined in config_helpers.go. Now what to do with that information:

  • The DefaultFilePath is defined using either $CF_HOME/.cf or $HOME/.cf ($HOME is the user’s home directory in Unix environments).
    • As a sanity check, if you are using a Unix environment run echo $CF_HOME. If it is non-empty, then run less $CF_HOME/.cf/config.json. If it is empty, run less $HOME/.cf/config.json. You should see the configuration file that cf target uses to report the org, space, and API information (there is other information in there as well).
  • Recall that UserEmail is defined in lines 199-204 of config_repository.go. You can see that config_repository.go also has the other information we wish to pull – the org (OrganizationFields), space (SpaceFields), API endpoint (ApiEndpoint), and API version (ApiVersion).

What to do with all of that

Basically everything in reverse. You supply the default file path, which is config.json, to NewRepositoryFromFilepath. config.json has the org, space, API endpoint, API version, and Access Token. The existing cf code decodes the Access Token and the UserEmail method extracts the email address from that information. Everything is just pulled directly from the repository you just defined.

Addendum: What is going on to get that email anyway?

Let’s take a quick look in config.json. The 7th line should be the Access Token, which should look similar to this:

"AccessToken": "bearer eyJhbGciOiJSUzI1NiJ9.eyJqdGkiOiI3NzI2ZDE2MS1hNWUzLTQwZjMtYTEzYy00OTlmMDNjOTBhZGIiLCJzdWIiOiI2Y2I5MTA0Yy1hZTMxLTQxYTMtOGQ4MS1jYjUxZjg0MTk5ZTMiLCJzY29wZSI6WyJjbG91ZF9jb250cm9sbGVyLmFkbWluIiwiY2xvdWRfY29udHJvbGxlci5yZWFkIiwiY2xvdWRfY29udHJvbGxlci53cml0ZSIsIm9wZW5pZCIsInBhc3N3b3JkLndyaXRlIiwic2NpbS5yZWFkIiwic2NpbS53cml0ZSJdLCJjbGllbnRfaWQiOiJjZiIsImNpZCI6ImNmIiwiZ3JhbnRfdHlwZSI6InBhc3N3b3JkIiwidXNlcl9pZCI6IjZjYjkxMDRjLWFlMzEtNDFhMy04ZDgxLWNiNTFmODQxOTllMyIsInVzZXJfbmFtZSI6ImFkbWluIiwiZW1haWwiOiJhZG1pbiIsImlhdCI6MTQxNzgxMTU3NywiZXhwIjoxNDE3ODEyMTc3LCJpc3MiOiJodHRwczovL3VhYS41NC4xNzQuMjI5LjExOS54aXAuaW8vb2F1dGgvdG9rZW4iLCJhdWQiOlsic2NpbSIsIm9wZW5pZCIsImNsb3VkX2NvbnRyb2xsZXIiLCJwYXNzd29yZCJdfQ.XNaYq8rxpvwWx9kySIDqbKs0BuyeOMMwAPb5YQaT-9MIyr3YalCE_2gTg-fl0xulj4u-VoNme3OGZ2T3tFFUfBKgo3U7R_pl5OpcaetKslbvKtYpne7N30KMQySMqVVVooGqlReoI_n5m5O7ZIASiG8P1QtwuVrZPkPhbjsGfBE",

Source: The above is the access token from a now-destroyed TryCF instance.

This is a JSON Web Token (JWT). You can read about JWT here. For now, all I really care about is that its structure is <header>.<claims>.<signature>. The <claims> section of the above token is between the two periods:

eyJqdGkiOiI3NzI2ZDE2MS1hNWUzLTQwZjMtYTEzYy00OTlmMDNjOTBhZGIiLCJzdWIiOiI2Y2I5MTA0Yy1hZTMxLTQxYTMtOGQ4MS1jYjUxZjg0MTk5ZTMiLCJzY29wZSI6WyJjbG91ZF9jb250cm9sbGVyLmFkbWluIiwiY2xvdWRfY29udHJvbGxlci5yZWFkIiwiY2xvdWRfY29udHJvbGxlci53cml0ZSIsIm9wZW5pZCIsInBhc3N3b3JkLndyaXRlIiwic2NpbS5yZWFkIiwic2NpbS53cml0ZSJdLCJjbGllbnRfaWQiOiJjZiIsImNpZCI6ImNmIiwiZ3JhbnRfdHlwZSI6InBhc3N3b3JkIiwidXNlcl9pZCI6IjZjYjkxMDRjLWFlMzEtNDFhMy04ZDgxLWNiNTFmODQxOTllMyIsInVzZXJfbmFtZSI6ImFkbWluIiwiZW1haWwiOiJhZG1pbiIsImlhdCI6MTQxNzgxMTU3NywiZXhwIjoxNDE3ODEyMTc3LCJpc3MiOiJodHRwczovL3VhYS41NC4xNzQuMjI5LjExOS54aXAuaW8vb2F1dGgvdG9rZW4iLCJhdWQiOlsic2NpbSIsIm9wZW5pZCIsImNsb3VkX2NvbnRyb2xsZXIiLCJwYXNzd29yZCJdfQ

If you paste that information into Base 64 Decode, you can see the user’s credentials – including the email field. (For TryCF the user_name and email are both admin.) If you paste in the above and decode it, you will see:

{"jti":"7726d161-a5e3-40f3-a13c-499f03c90adb","sub":"6cb9104c-ae31-41a3-8d81-cb51f84199e3","scope":["cloud_controller.admin","cloud_controller.read","cloud_controller.write","openid","password.write","scim.read","scim.write"],"client_id":"cf","cid":"cf","grant_type":"password","user_id":"6cb9104c-ae31-41a3-8d81-cb51f84199e3","user_name":"admin","email":"admin","iat":1417811577,"exp":1417812177,"iss":"https://uaa.54.174.229.119.xip.io/oauth/token","aud":["scim","openid","cloud_controller","password"]}

Feel free to try it with your own Access Token! :)

[From my work blog here.]

PS – It’s not a Wednesday, but most of my work related blog posts are going to be Wednesday so to keep it all together…

Design a site like this with WordPress.com
Get started